I'm just replicating Professor Welser's post on TUESDAY, APRIL 24, 2012
"Plot different characters and colors according to factor on third variable"
The only difference is that i used ifelse statement Instead of subsetting data. I created a grouping variable (Geek/Non) that was automatically added to the existing dataset
by using ifelse()
#survey_final$TwoPlusComputers<- .... this adds a new colomn into your existing data (e.g., myIndices)
#1 or less = non; 2 or more = Geek
#factor() is like the levels of categorical variable in spss
myIndices$TwoPlusComputers<- factor(
ifelse(survey_final$computers <= 1,0,1),
levels=c(0,1),
labels=c("Non-Geeks","Geeks"))
#now you have a new colomn called TwoPlusComputers added to your Indices/data
#you can now use coplot based on the illustration of Prof. Welser
#coplot ( y ~ X | Z)
# you can also use ggplot2
#if you don't have ggplot2, run the following
#install.packages("ggplot2")
library(ggplot2)
#qplot(x,y,data=yourdata,....)
#I. BY COLOR
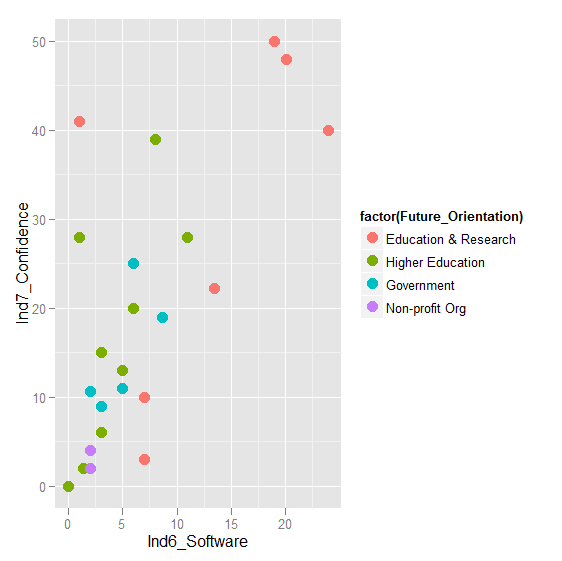
qplot(Ind6_Software,Ind7_Confidence, data=myIndices,
size=factor(TwoPlusComputers), size=I(4),
xlab="# Of Software Used",
ylab="Confidence Analyzing Data",
main="Software predicts overall confidence (Geeks Vs Non)")

#II. BY SIZE
qplot(Ind6_Software,Ind7_Confidence, data=myIndices,
size=factor(TwoPlusComputers), size=I(4),
xlab="# Of Software Used",
ylab="Confidence Analyzing Data",
main="Software predicts overall confidence (Geeks Vs Non)")

#III. BY SHAPE
qplot(Ind6_Software,Ind7_Confidence, data=myIndices,
shape=factor(TwoPlusComputers), size=I(4),
xlab="# Of Software Used",
ylab="Confidence Analyzing Data",
main="Software predicts overall confidence (Geeks Vs Non)")

qplot(Ind6_Software, Ind7_Confidence, data=myIndices,
xlab="# Of Software Used",
ylab="Confidence Analyzing Data",
main="Software predicts overall confidence (Geeks Vs Non)",
facets= .~TwoPlusComputers) + geom_smooth()

Adil
No comments:
Post a Comment