Thursday, May 31, 2012
Another website for regression models
Here is another website for regression models! http://www.jeremymiles.co.uk/regressionbook/extras/appendix2/R/
Regression Model
http://www.statmethods.net/stats/regression.html
Found this when I was looking up how to do a regression model. Hope it helps someone else too!
Found this when I was looking up how to do a regression model. Hope it helps someone else too!
Tuesday, May 29, 2012
Finding the "Top Dogs": Recoding for the Top Quartile (in R)
This post deals with separating out the top (or bottom)
quartile of a given variable.
As part of our final project, my group redefined the concept
of opinion leaders in the diffusion study our class looked at. (Which is more
for background information than anything else, but it may help to understand
similar situations in which this kind of recoding could come in handy.)
Previously this study had defined opinion leaders (think “the cool kids that
everyone wants to be like”) as those with admin status on the site (in this
case Wikipedia). We added a couple more variables: barn stars (awarded by peers/other
Wikipedia editors), and the number of edits to their user profile page. It’s
this “user edits” variable that we’re concerned with in this post.
Since the original dataset had data from various timeframes,
we decided to create three new variables delineating the number of user profile
pages before and during the study’s time period, as well as one adding both
together.
First we had to create an index which combined the "Pre" and "Period" timeframes into a "Both" variable, thusly:
userEditsBoth<-(userEditsPre+
userEditsPeriod)
Next we ran a summary of the “userEdits” (for each of the
timeframes described above) variable to find the values of the upper
quartile. The syntax looks like this:
summary(userEditsPre)
summary(userEditsPeriod)
summary(userEditsBoth)
The results looked something like this:
> summary(userEditsPeriod)
Min. 1st Qu. Median Mean 3rd Qu. Max.
0.00 0.00 1.00 12.56 8.00 3239.00
See the 8.00 under "3rd Qu." and then 3239.00 under "Max."? That's where we got the values to use in the "highuserEditsPeriod" below. Simple enough. We recoded as a binary variable with just
the top quartile of values = 1 and the rest = 0. Like this:
highuserEditsPre<-recode(userEditsPre, "51:6143='1';
else='0'")
highuserEditsPeriod<-recode(userEditsPeriod, "8:3239='1';
else='0'")
highuserEditsBoth<-recode(userEditsBoth,
"66:9382='1'; else='0'")
(Yes, someone really did make 3,239 edits to their profile
page in a single month. I know!)
You cannot remain unhappy when you look at the lowl.
After that, we were able to use this new variable (highuserEdits...) in the index for our new variable that redefines opinion leaders in
this study (to examine whether they were more or less likely to adopt a new
tool to suggest pages for them to edit).
But that is another story…
The members of the group involved in this class project are Heather Dumas, Bree Stewart, and Xuan He.
Tuesday, May 22, 2012
Understanding how to visualize data onto graphs
With our assignment for homework 3/4 we have to get familiar with one of the data sets and R and then extend the analysis of the data by using R. To do this we have to understand how to look at data and then visualize it in graphs to help us better understand correlations. I found a few helpful videos on Khan Academy to help understand how we visualize data in graphs. This may seem too basic for some people in the class but it was helpful for me at the level I am at in my understanding of data analysis.
http://www.khanacademy.org/math/algebra/ck12-algebra-1/v/histograms
http://www.khanacademy.org/math/algebra/linear-equations-and-inequalitie/v/interpreting-linear-graphs
http://www.khanacademy.org/math/algebra/ck12-algebra-1/v/histograms
http://www.khanacademy.org/math/algebra/linear-equations-and-inequalitie/v/interpreting-linear-graphs
Friday, May 18, 2012
HW 3/4 work items
In class on Tuesday I mentioned several things for you to work on this weekend. Here is a list and a note about some resources that I uploaded.
- Resources:
- The codebooks for both datasets are shared in your google doc folders, and are linked on the crash course in statistics page.
- The three chapters from the stats book are linked on that page as well. They ought to help you understand how regression is used and what the results mean.
- I added the third chapter Friday (on multiple regression)
- Tasks
- Read the chapters on regression.
- Get more familiar with R code used in the Adoption research.
- use the example code.
- read the code to figure out what the parts do
- Start building your version of the code in a text file or R syntax file
- advantage of text file: R crashes
- When R crashes, the notepad does not.
- come to class on tuesday with commented code that you made this weekend!
- Work with the sections on:
- histograms (as demonstrated in class and the recent video)
- correlation matrices
- regressions
- other stuff
- Find Adil's posts on this blog.
- read the posts, and copy the syntax from his examples
- apply that code to the data from the Adoption example
- document and comment your new code
- Make sure you make progress on your participation
- log in to Khan academy and watch relevant videos (unless you already have viewed plenty of them while logged in)
- create at least 1 valuable post to the blog. (see Adil's examples)
- Read the papers and look at the slide presentations for the example study that you will work with for your assignment.
- Start figuring out what your extension study will do.
- Anything else?
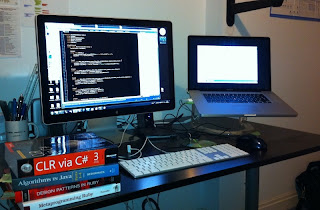
Home office productivity
- Besides the cheerful expressions, notice the amount of screen space at each work station.
- Higher.productivity<-screenspace(second.monitor)
- Efficient.Cost.Effective<- Laptop.station(monitor +external keyboard +mouse)
- see below. (not my setup, but this is the idea)
Thursday, May 17, 2012
Looking at data transformations
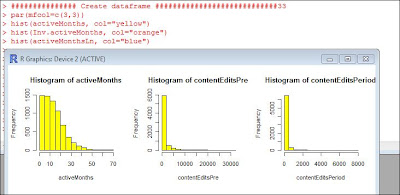
The most recent video gives some instructions for working with the adoption of innovation data.
The video asks you to compare the distributions of the raw, inverse transformed, and logged versions of three different count variables used in the diffusion of innovation paper.
Monday, May 7, 2012
R "how to" in 2 min videos
Fast paced, a little goofy, but some helpful stuff:
http://www.twotorials.com/2012/05/ninety-two-minute-r-tutorial-videos.html
Subscribe to:
Comments (Atom)


